First steps with FACURA: Your pragmatic entry into smart indirect procurement
1. Introduction
Automation is no longer optional in industrial procurement. Given the increasing demands for efficiency, compliance, and transparency, the question is no longer whether to digitize, but rather what the financial benefits will be . The key performance indicator for evaluation is the return on investment (ROI) . However, determining ROI is particularly complex in indirect procurement – investments are often diffuse, and potential savings are difficult to quantify. This article provides a systematic approach to evaluating the financial impact of automation initiatives in procurement – fact-based, field-tested, and directly linked to real process and cost data.
The figures speak for themselves: Over 40% of finance professionals and 33% of accounting professionals worldwide identify the automation of purchasing and procurement processes as a top priority. At the same time, the current market situation reveals enormous growth potential: The global procurement software market is projected to grow at a compound annual growth rate (CAGR) of 9.7%, from USD 7.9 billion in 2025 to USD 21.9 billion by 2035. In Germany, companies are already investing an average of €1.2 million annually in the digitalization of their procurement processes, while aiming for a digitalization rate of 70% by 2027.
2. ROI in purchasing: Definition and meaning
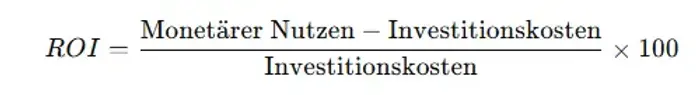
ROI (Return on Investment) measures the economic benefit of an investment in relation to the costs incurred. In procurement, this primarily concerns process investments – for example, in digital ordering solutions, OCR-supported invoice processing, or automated demand forecasting.
Calculation formula:
3. Investment analysis: Which costs need to be considered?
A sound investment analysis begins with the systematic recording of all relevant cost categories. Especially in indirect procurement, where automation measures often need to be integrated into heterogeneous IT and process landscapes, transparency in planning is crucial. Typical cost categories include:
| Type of cost | Typical positions |
|---|---|
| One-time investments | License fees, system implementation, interface development, training |
| Ongoing operating costs | Software maintenance, service contracts, further development |
| Internal resource commitment | Project management, key user time, process adjustments |
| Opportunity costs | Delayed implementation of other projects, resource diversion |
Current market data shows that the procurement automation market will grow from USD 5.5 billion in 2024 to USD 12.3 billion by 2033 (CAGR: 9.8%), reflecting the increasing willingness of companies to invest. In Germany, the procurement software market already amounted to EUR 1.2 billion in 2024 and is projected to grow to EUR 2.6 billion by 2030.
Crucial for investment evaluation is not solely the amount of expenditure, but its distribution over the usage period and the possibility of allocating it according to the principle of causation. It is also important to consider indirect costs, such as those resulting from process changes, necessary coordination with IT, or training measures in procurement.
A complete investment analysis therefore not only reflects the acquisition costs, but also the organizational implementation effort – including potential risks such as delays or incomplete system integration.
4. Cost-benefit analysis: Comparison of three automation approaches in indirect procurement
Selecting the right automation solution depends heavily on the company’s maturity level, its purchasing structure, and its strategic objectives. Three common approaches to indirect procurement are:
- eProcurement systems with OCI integration
- Framework agreements with major suppliers
- 1-vendor model (centralized order processing)
4.1 eProcurement with OCI catalog integration
Brief description:
OCI (Open Catalog Interface) interfaces connect an ERP system with supplier catalogs, allowing users to access online shops directly from within the internal system. Ordering and approval processes are integrated into the system.
Demarcation:
Highly system-supported, but dependent on catalog quality and supplier maintenance. Works well for standardized requirements – less flexible for special requests.
Benefit analysis (annually for 1,000 transactions):
- Purchasing process time: Savings of 15 min/transaction = 250 h = €12,500 (€50/h)
- Accounting processing time: Savings of 10 min/transaction = 167 h = €8,350 (€50/h)
- Accounts payable setup: Partially eliminated through consolidation, however 20% new entries → 200 transactions at 60 min each = 200 h = €10,000
Total benefit per year: €30,850
Practice confirms these calculations: E-procurement systems can reduce administrative costs by up to 80% and generate compliance savings of an average of 13.2% for goods and services.
Strengthen:
- Good integration into ERP
- Controlled process flow
- Transparency through structured catalogs
Weaken:
- High maintenance effort for catalogs
- Limited supplier flexibility
- High initial integration costs
4.2 Framework agreements with major suppliers
Brief description:
Central agreements with selected suppliers, often supplemented by EDI or email orders. Standard items are defined in terms of price and delivery conditions.
Demarcation:
Particularly efficient when demand remains constant. Limited in selection and flexibility; special requirements are usually not covered.
Benefit analysis (annually for 1,000 transactions):
- Purchasing process time: Savings of 10 min/transaction = 167 h = €8,350
- Accounting processing time: Savings of 10 min/transaction = 167 h = €8,350
- Accounts payable setup: 90% through framework suppliers → only 100 new setups at 60 min each = 100 h = €5,000
Total benefit per year: €21,700
Studies show that supplier consolidation and volume bundling lead to significant cost savings. AI-supported supplier negotiations can enable cost savings of up to 40%.
Strengthen:
- Negotiating power in quantity bundling
- Clear contract terms
- Partial automation possible via interfaces
Weaken:
- Limited product availability
- No ad-hoc demand possible
- Administrative effort during contract negotiations
4.3 Single-creditor model
Brief description:
An external service provider handles the operational procurement of any items – regardless of the shop, product, or supplier. The company has only one creditor in its system and receives a single, unified invoice.
Demarcation:
Maximum relief with minimal system integration. Particularly suitable for special needs, one-off items, or heterogeneous requirements.
Benefit analysis (annually for 1,000 transactions):
- Purchasing process time: Savings of 20 min/transaction = 333 h = €16,650
- Accounting processing time: Savings of 15 min/transaction = 250 h = €12,500
- Accounts payable: completely eliminated = 1,000 * 50% of transactions at 60 min = 1,000 h = €25,000
Total benefit per year: €54,150
The efficiency of the single-vendor model is supported by market studies: The indirect procurement outsourcing market is growing at a CAGR of 7.2% and will reach USD 10.2 billion by 2033. Companies that use AI in procurement achieve cost savings of up to 20%.
Strengthen:
- Maximum flexibility
- No more accounts payable management required
- Standardized documents, minimal training required
Weaken:
- Processing fee per order (cost depends on the model)
- Dependence on the service provider in the processing
The financial benefits are quantitatively highest with complete outsourcing via a single-vendor model – particularly due to the complete elimination of accounts payable costs. Those who prioritize high standardization and supplier loyalty, on the other hand, benefit from e-procurement or framework agreements – albeit with significantly limited flexibility for non-catalogable requirements.
| statistics | Value | source | Year |
|---|---|---|---|
| Process automation reduces manual ordering costs by | 80% | Gartner Group | 2024 |
| Average cost savings through e-procurement compliance | 13.2% | Aberdeen Group | 2024 |
| Reducing order time through automation | 16 hours less | APQC Research | 2024 |
| Maverick spend share in typical companies | 1.8% | APQC 2022 | 2022 |
| Cost savings through the elimination of maverick spend | 16% | Veridiion/Order.co | 2024 |
| Reduction of transaction costs through e-payments | up to 0.38% | Chilean e-procurement study | 2009 |
| ROI of automation solutions in the first year | 30-200% | Flobotics RPA Statistics | 2025 |
| Average cost savings per $1,000 purchase (without vs. with Maverick Buying) | 2.58 USD | APQC Analysis | 2024 |
| Global Procurement Software Market Growth (CAGR) | 9.7% | Market Research | 2025 |
| Europe B2B Payments Market Growth (CAGR) | 9.8% | Market Research | 2024 |
| Germany Procurement Software Market Value 2024 | €1.2 billion | Market Research | 2024 |
| Average annual investment in digitalization (Germany) | €1.2 million | PwC Digital Procurement Survey | 2024 |
| Share of manual procurement processes (Europe) | 41% | PwC Digital Procurement Survey | 2024 |
| Target digitization of procurement by 2027 | 70% | PwC Global Survey | 2024 |
| Cost savings through AI-supported procurement systems | 10-20% | Kronosgroup/McKinsey | 2025 |
| Reducing administrative costs through automation | up to 80% | Medius/IBM | 2025 |
| Productivity increase through RPA adoption | 22% increase | McKinsey AI adoption | 2024 |
| Market size of indirect procurement outsourcing in Europe | USD 2.5 billion (2024) | Market Report | 2024 |
| Growth of the Procurement Automation Market (2024-2033) | 9.8% | Market Report | 2025 |
| Average processing time reduction for e-ordering | 0.234 units improvement | Kenya Government Study | 2024 |
5. ROI calculation comparison: Which approach really pays off?
A clear ROI is crucial for providing a sound justification for automation initiatives in procurement to management and controlling. The following overview illustrates how the total benefits and investment costs compare for 1,000 procurement transactions per year – differentiated according to the three common solution approaches.
5.1 eProcurement with OCI catalog integration
| parameter | Value |
|---|---|
| Total benefit pa | €30,850 |
| Investment costs pa | €18,000 |
| ROI | (30,850 – 18,000) / 18,000 = 71.4% |
| Payback period | 7–8 months |
Classification:
A traditional eProcurement system offers a significant increase in efficiency but requires initial investments in licenses, interfaces, and catalog maintenance. Amortization occurs within the first year, provided the system is actively used and maintained. Studies confirm ROI values of 30-200% in the first year for automation solutions.
5.2 Framework agreements with major suppliers
| parameter | Value |
|---|---|
| Total benefit pa | €21,700 |
| Investment costs pa | €5,000 (internally estimated negotiation and maintenance costs) |
| ROI | (21,700 – 5,000) / 5,000 = 334% |
| Payback period | approximately 2 months |
Classification:
Framework agreements offer an excellent cost-benefit ratio under stable demand patterns – provided the purchasing organization has the necessary internal negotiating capacity. This high return is less pronounced with a low degree of standardization or highly variable requirements. Manufacturing companies achieve cost savings of 20-30% through e-procurement systems while simultaneously improving supplier quality.
5.3 Single-creditor model
Brief description:
In the single-vendor model, an external service provider handles all operational procurement – independent of the online shop or supplier. The company orders from only one vendor and receives a consolidated invoice. No implementation or interface costs are required – the operational benefits are realized immediately from the first transaction.
Financial assessment:
| parameter | Value |
|---|---|
| Total benefit pa | €54,150 (see section 4.3) |
| Investment costs | €0 (no system implementation, no fixed costs) |
| Processing fees | Estimated 10–15% per transaction → approx. €12,000 per year |
| Net benefit | €54,150 – €12,000 = €42,150 |
| ROI | direct benefit |
| Payback period | Immediate benefits from the first order |
Classification:
The single-vendor model achieves the highest financial impact with the lowest implementation effort. Since no system integration is required, the typical amortization period is eliminated. Service costs are volume-dependent and transparently calculable. This approach is particularly attractive with a large number of vendors, highly variable demand from different stakeholders, and frequent special requirements.
Summary of ROI comparison:
| Solution approach | Total benefit pa | Investment costs | Processing or operating costs | Net benefit pa | ROI | Payback period |
|---|---|---|---|---|---|---|
| eProcurement (OCI) | €30,850 | €18,000 | – | €12,850 | 71.4% | 7–8 months |
| Framework agreements | €21,700 | €5,000 | – | €16,700 | 334% | approximately 2 months |
| 1-creditor model | €54,150 | €0 | Processing fees | €42,150 | direct benefits from the start | immediately |
6. Strategic impact of automation
- Role change from operational orderer to process owner
- Data-driven management through valid purchasing KPIs
- Increased flexibility through modular solutions without IT dependency
- Contribution to corporate management through reliable cost data and process reliability
The strategic importance is underscored by recent study results: 75% of companies have planned data analytics and reporting improvement initiatives for 2024, while cost reduction and strategic sourcing remain at the forefront at 61%. At the same time, over 61% of German companies are already using AI and analytics in procurement platforms for strategic sourcing decisions.
These effects cannot be directly quantified, but often have a higher long-term economic value – for example, through quality improvements, employee retention, or compliance. Companies with a high degree of digitalization succeed in generating value through data availability in 80% of cases.
7. Recommendation for action: This is how you proceed
- Systematically record cost and benefit parameters
- Effort per process, employee retention, supplier structure
- Assess potential savings realistically, not optimistically.
The importance of this is underscored by current data: 44% of procurement decision-makers identify efficiency and complexity as primary challenges for their procurement processes. Maverick buying can account for up to 80% of total purchasing, highlighting the urgency of systematic data collection.
- Define pilot area
- Special requirements are ideally suited: High case numbers, many individual processes, often manual
- Providers like FACURA offer particularly low entry barriers here.
- Development towards key performance indicator (KPI) management
- Evaluate ROI regularly
- Combination with purchasing KPIs such as “cost per order”, “process throughput time”, etc.
The speed of implementation is particularly relevant: Procurement departments are aiming for a digitization rate of 70% by 2027, while 51% of companies still perform up to half of their payment operations manually.
Conclusion
The economic evaluation of automation projects in procurement requires precision, a systematic approach, and a deep understanding of one’s own process landscape. ROI offers a robust metric for this – provided it is recorded correctly. Companies that start with pragmatic solutions like FACURA’s single-vendor model benefit particularly quickly from measurable effects – both operationally and strategically.
Market developments confirm the trend towards automation: The European procurement software market is projected to grow from USD 9.81 billion in 2024 to USD 30.57 billion by 2033 (CAGR: 13.7%). 87% of companies already use e-procurement tools, while AI-driven procurement strategies lead to a 15% reduction in operating costs.
A reliable ROI calculation is not an end in itself, but a prerequisite for professional investment decisions in procurement. And a key to positioning procurement as a data-driven, value-creating function.
Note regarding the information:
The amounts and percentage savings mentioned are solely intended to illustrate typical effects of automation measures in indirect procurement. They are based on realistic, yet generalized assumptions and can vary considerably depending on company size, process maturity, cost structure, and the solution implemented. A reliable ROI assessment always requires a company-specific analysis of the current processes and framework conditions.